Dollar-Cost Averaging is a fancy term for a series of regular equal value investments into the same product over an extended time regardless of the product’s changing price.
Generally, people make equal periodic investment purchases for their own convenience; they match their buys with their employer’s payroll cycle. People with 401k plans, including me, are almost always dollar-cost averaging into their 401k investments for example.
So what? Who cares?
Virtually no one can successfully time the market over a long period. You can’t always correctly predict the price of your chosen investment in order to buy when it’s low and sell when it’s high.
Since you really don’t know which way the market will go in the near term, if you make a single lump-sum investment you may accidentally buy just before the price goes up. You may also buy just before the price crashes.
One reason to Dollar-Cost Average is to reduce the price direction risk of a fixed dollar investment. Spread your $10,000 lump-sum investment as 10 monthly investments of $1,000 each and you'll find the entry prices of each of the 10 investments are different. Some are higher and some lower than the first purchase.
The hope is that your average price is better than your single lump-sum price would've been.
Happiness is a Volatile Share Price
But, there’s another advantage of long term Dollar-Cost Averaging – the kind available thru monthly DRIP account purchases. The Excel workbook below shows the number of shares that would be purchased and their value if equal annual investments were made in a DRIP over 25 years with all dividends reinvested. It also assumes that the DRIP stock increases in value at a consistent 6% rate every year.
6% Constant Annual Earnings Per Share Growth
After 25 years of $600 annual investments the investment grows to $63,563.21 with 448.54 shares in the account at a presumed market price of $141.71 per share. The sum of the annual investments is only $14,994.05 – a pretty good return overall.
The next Excel workbook shows an example of what happens in reality. The stock price doesn’t grow steadily every year. Instead it bounces around. Sometimes up. Sometimes down. But, in the end, it reaches the same price - $141.71 per share.
6% Average EPS Growth with Volatility
The difference is each annual $600 investment buys either more shares or less as the share price fluctuates.
The example has 6% average annual growth but with fluctuations of 18.12% up or down around the average. The result is an ending value of $77,916.60 with a total of 549.83 shares in the account.
Try it for Yourself
Obviously, I forced the ending share price to be the same by tweaking the fluctuation percentage. You can change the parameters in the workbook to see how different values of average growth or the volatility (fluctuation percentage) affect the outcome. But the typical case is that volatility, as long as some of it takes the price below the average increase curve, will result in more shares held in the end.
That’s why Warren Buffet says to be happy when share prices fall – Mr. Market is just holding a sale!
The next post will take up the idea of “diversification” in DRIP accounts.
Link to Topics in the Special Report - How to Get Rich Slowly DRIP by DRIP
Friday, October 29, 2010
Thursday, October 21, 2010
How to Get Rich Slowly DRIP by DRIP: Transaction Costs Compared to Mutual Funds
You pay less for the privilege of investing in a DRIP account compared to mutual funds. Paying less means more of your money works for you - increasing your net worth.
The transaction costs for HAS (Hasbro), a typical DRIP stock, were discussed in the previous post. Hasbro’s fee schedule is reproduced below.
Example Fee Schedule
The fee structure for Hasbro (HAS) is:
The transaction costs for HAS (Hasbro), a typical DRIP stock, were discussed in the previous post. Hasbro’s fee schedule is reproduced below.
Example Fee Schedule
The fee structure for Hasbro (HAS) is:

DRIP vs Mutual Fund – Head to Head
In the following Excel spreadsheet you can see the effect of equal investment streams going into a DRIP account compared to a no-load mutual fund with zero brokerage commissions, a 1% annual management fee, 4% reinvested dividend yields, and 6% annual net asset value (NAV) growth. These are pretty decent numbers for a mutual fund. Few have done this well over any significant time period.
After 25 years the mutual fund’s value grows to $56,609.17. The same investment stream in a DRIP grows to $64,858.64 – a difference favorable to the DRIP of $8,249.47; A much larger difference than buying individual stocks thru a broker.
Why? Because the 1% management fee is 1% of the entire value of the investment – every year. Brokerage commissions are incurred only when you buy or sell. Frequent trading will cause commissions to mount up fast. But, if you hold high quality stocks for the long term commissions are insignificant.
What If?
This example is designed to be favorable to the mutual fund. Few mutual funds yield 4% dividends and few have management fees as low as 1%. Only index funds are that efficient and not all of them.
You can change the parameters in this spreadsheet.
Experiment with different commission fees, dividend yields, EPS growth rates or annual investments and see how they affect results. For example, changing the annual management fee to 0.5% reduces the difference to just $3,086.64 – still much more than when DRIPs are compared to buying and holding stock thru a broker.
The topic of the next post is Dollar-Cost Averaging.
Link to Topics in the Special Report - How to Get Rich Slowly DRIP by DRIP
Tuesday, October 12, 2010
How to Get Rich Slowly DRIP by DRIP: Transaction Costs Compared to Brokerages
You pay less for the privilege of DRIP account investing compared to using a broker – or mutual funds, but that’s another post.
Paying less to play means more money goes into your investment - increasing your net worth.
You buy stocks for your DRIP plan directly from the stock issuing company. The “Transfer Agent” merely administers the transactions. This means each DRIP plan can have a different fee structure. Some plans charge fees for purchases, some discount the purchase price from the current market price. All charge a fee when you sell.
Example Fee Schedule
The fee structure for Hasbro (HAS) is shown below.

HAS doesn’t allow buying the initial investment thru the plan administrator (Transfer Agent). You must transfer at least one share from your broker or mail an actual stock certificates to set up the account. As shown in the table above, there’s no fee to set up the account.
After the account is set up you can buy additional shares thru the Transfer Agent without fees. If you buy shares thru a broker you will pay a brokerage commission with each transaction. As a point of reference, my transaction costs thru my broker are $5.95 per transaction.
DRIP’s Aren’t for Trading
My broker charges the same $5.95 per transaction whether I’m buying or selling. You can see in the chart that Hasbro charges $10.00 per transaction PLUS $0.15 per share when you sell. So if I sold all of my HAS shares – assuming I owned 100 shares – my DRIP selling cost would be $10 + $15 (100 shares * $0.15/share) = $25 compared to only $5.95 if I sold the same 100 shares thru my broker. DRIP accounts are not for trading.
If you accumulate shares in your DRIP and hold them for the long term, the DRIP is very efficient in terms of transaction costs. None are charged on your monthly purchases. If I bought shares monthly thru my broker I’d pay $71.40 a year compared to zero in my DRIP. The higher DRIP selling fee is overwhelmed by the commissions charged on regular purchases of stock thru a broker.
DRIP vs Brokerage – Head to Head
In the Excel spreadsheet below you can see the effect of equal investment streams going into a DRIP account compared to a brokerage account given $5.95 brokerage commissions, 4% reinvested dividend yields, and 6% annual growth in earnings per share (EPS).
After 25 years the Brokerage investment stream grows to a value of $64,279.42. The same investment stream in a DRIP grows to $64,858.64 – a favorable difference to the DRIP of $579.22. Not much over 25 years.
What If?
This example, however, is designed to be extremely favorable to the brokerage account. There’s no trading and the buys are lumped into annual purchases of $600 each. In the DRIP, the annual $600 investment could be monthly purchases of $50 each – still with zero transaction costs. An equivalent investment stream in the brokerage account would reduce the value of the account to $57,197.38 – a favorable advantage to the DRIP of $6,950.58.
You can change the parameters in this spreadsheet.
Experiment with different commission fees, dividend yields, EPS growth rates or annual investments and see how they would affect results
In the next post, I’ll compare DRIP account investments to mutual funds. I think the results will surprise you.
Link to Topics in the Special Report - How to Get Rich Slowly DRIP by DRIP
Wednesday, October 6, 2010
How to Get Rich Slowly DRIP by DRIP: How to Reinvest Your Dividends
Adding the power of compounding dividends, regular dividend increases and appreciating share value will produce a much higher investment value over many years. I strongly recommend you reinvest your dividends – at least until you need them for income.
The Computershare web site isn’t the friendliest. But setting up your Computershare DRIP account to automatically reinvest dividends is easy despite awkward site navigation.
The embedded slide presentation contains instructions to will help you avoid minor inconveniences I’ve run into on http://www.computershare.com/.
Transaction costs are the subject of the next post.
Link to Topics in the Special Report - How to Get Rich Slowly DRIP by DRIP
Friday, October 1, 2010
How to Get Rich Slowly DRIP by DRIP: Why Should You Reinvest Your Dividends?
Well, why SHOULD you reinvest your dividends?
You could take your dividend money in cash and spend it. And, one day you will want to do just that. I plan to use future dividends as a major source of retirement income.
But until then, my dividends are reinvested.

Dividend Growth Stock
A well chosen dividend growth stock has demonstrated its ability to grow earnings per share and therefore - over time – its share value. It’s also increased its annual dividend in proportion to earnings growth.
A company may not do in the future what it did in the past; it’s nevertheless more likely to continue such policies than is a company that’s never consistently grown its earnings and dividends.
Compounding Earnings per Share (EPS)
A conservative example of a typical dividend growth stock – perhaps an electric utility – is shown in the chart below.
An original investment valued at $1,000 is assumed; with no additional future purchases. All dividends are assumed paid in cash and used as disposable income.
For simplicity, the normal fluctuations of business are assumed away - at conservative averages. A constant 4% dividend yield is assumed; as is constant annual earnings per share (EPS) growth of 6%. Constant market valuation based on the Price/Earnings Ratio (P/E) would make the value of the investment increase at the same 6% rate of EPS growth. Also, all compounding is shown as annual. Quarterly compounding (the reality) would increase the resulting values in all cases.
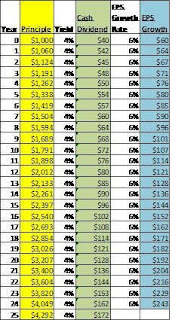
After 25 years of 6% annual growth your original $1,000 investment is worth $4,292 and the you received $2,366 in quarterly dividend payouts. Not bad.
Compounding EPS & Dividends
The next chart uses the same assumptions except instead of spending the dividends; you automatically reinvests them in additional shares of the company’s stock.
Look at what happens to your investment value. Look at what happens to your annual dividends available for retirement income at the end of year 25.
The $1,000 investment has grown to $10,835 and your annual disposable dividend income is $433 – more than twice as much and a nice chunk of change. Congratulations!
Compounding With Monthly Investments
Now what would become of your original $1,000 if you also made additional $25 monthly investments or $300 per year?

After 25 years of adding $25 per month to your investment – a total of $7,500 – your $8,500 (original $1,000 + the additional $7,500) is now worth $40,339. And, your available dividend income is $14,349 per year. Wow!
Getting Rich DRIP by DRIP
Suppose you did that with two or three more stocks – or even five. Suppose you increased your monthly investments as your income grows – say 3% per year.

In the chart above you start out with five $1,000 investments and add $25 per month to each of them. You increase your monthly investments by 3% per year and end up with a total cash investment of $15,938 ($5,000 original investment + $10, 938 in total monthly investments over 25 years).
This produces a value of $91,635. Your dividend income rises to $33,944 a year; all with a very modest commitment.
You can do even better that that – you can get rich DRIP by DRIP.
In the next post I’ll show you how to set up your DRIP account to automatically reinvest your dividends. It’s easy. It’s worth it.
Link to Topics in the Special Report - How to Get Rich Slowly DRIP by DRIP
You could take your dividend money in cash and spend it. And, one day you will want to do just that. I plan to use future dividends as a major source of retirement income.
But until then, my dividends are reinvested.
Dividend Growth Stock
A well chosen dividend growth stock has demonstrated its ability to grow earnings per share and therefore - over time – its share value. It’s also increased its annual dividend in proportion to earnings growth.
A company may not do in the future what it did in the past; it’s nevertheless more likely to continue such policies than is a company that’s never consistently grown its earnings and dividends.
Compounding Earnings per Share (EPS)
A conservative example of a typical dividend growth stock – perhaps an electric utility – is shown in the chart below.
An original investment valued at $1,000 is assumed; with no additional future purchases. All dividends are assumed paid in cash and used as disposable income.
For simplicity, the normal fluctuations of business are assumed away - at conservative averages. A constant 4% dividend yield is assumed; as is constant annual earnings per share (EPS) growth of 6%. Constant market valuation based on the Price/Earnings Ratio (P/E) would make the value of the investment increase at the same 6% rate of EPS growth. Also, all compounding is shown as annual. Quarterly compounding (the reality) would increase the resulting values in all cases.
After 25 years of 6% annual growth your original $1,000 investment is worth $4,292 and the you received $2,366 in quarterly dividend payouts. Not bad.
Compounding EPS & Dividends
The next chart uses the same assumptions except instead of spending the dividends; you automatically reinvests them in additional shares of the company’s stock.
Look at what happens to your investment value. Look at what happens to your annual dividends available for retirement income at the end of year 25.
The $1,000 investment has grown to $10,835 and your annual disposable dividend income is $433 – more than twice as much and a nice chunk of change. Congratulations!
Compounding With Monthly Investments
Now what would become of your original $1,000 if you also made additional $25 monthly investments or $300 per year?
After 25 years of adding $25 per month to your investment – a total of $7,500 – your $8,500 (original $1,000 + the additional $7,500) is now worth $40,339. And, your available dividend income is $14,349 per year. Wow!
Getting Rich DRIP by DRIP
Suppose you did that with two or three more stocks – or even five. Suppose you increased your monthly investments as your income grows – say 3% per year.
In the chart above you start out with five $1,000 investments and add $25 per month to each of them. You increase your monthly investments by 3% per year and end up with a total cash investment of $15,938 ($5,000 original investment + $10, 938 in total monthly investments over 25 years).
This produces a value of $91,635. Your dividend income rises to $33,944 a year; all with a very modest commitment.
You can do even better that that – you can get rich DRIP by DRIP.
In the next post I’ll show you how to set up your DRIP account to automatically reinvest your dividends. It’s easy. It’s worth it.
Link to Topics in the Special Report - How to Get Rich Slowly DRIP by DRIP
Subscribe to:
Posts (Atom)


