Link to Topics in the Special Report - How to Get Rich Slowly DRIP by DRIP
Thursday, December 16, 2010
How to Get Rich Slowly DRIP by DRIP: Transaction History
Instructions for the transaction history a Computershare DRIP stock are provided in the slide show below. But it works best if your browser is Internet Explorer. The slide show is narrated, but only if you download it into PowerPoint.
Friday, December 10, 2010
How to Get Rich Slowly DRIP by DRIP - Set Up a One-Time Investment
Instructions for setting up a Computershare DRIP stock for a one-time investment are provided in the slide show below. The slide show is narrated, but only if you download the it into PowerPoint.
Link to Topics in the Special Report - How to Get Rich Slowly DRIP by DRIP
Link to Topics in the Special Report - How to Get Rich Slowly DRIP by DRIP
Thursday, December 2, 2010
How to Get Rich Slowly DRIP by DRIP: Setting Up for Dividend Reinvestment
Instructions for setting up a Computershare DRIP stock for automatic dividend reinvestment are provided in the slide show below. The slide show is narrated, but only if you download the it into PowerPoint.
Link to Topics in the Special Report - How to Get Rich Slowly DRIP by DRIP
Link to Topics in the Special Report - How to Get Rich Slowly DRIP by DRIP
Thursday, November 25, 2010
How to Get Rich Slowly DRIP by DRIP: Gifts to My Children
Motivation
My kids are both adults. They live in Texas and I live in Virginia. I talk to them on the phone occasionally but seldom see them.
During the first few years of being half a continent away I still thought I knew them pretty well; enough that I could pick birthday and Christmas gifts for them that they’d like.
But, as the years went by they grew older - less & less like the teenagers I remembered. Buying presents became difficult.
During this same time my interest & knowledge about investing grew. And along the way I discovered DRIP accounts.
Discovery
After experimenting with my own DRIP for about a year I thought of opening DRIP accounts in the names of my two adult children. The idea was to take money I would normally spend for their Christmas and birthday presents and use it to buy shares of stock. I could also use the DRIP accounts and occasional statements to teach them about compound interest, dollar-cost averaging, and dividends; and, to encourage them to begin investing in their own future.
Preparation
The first thing I did was to prepare Excel spreadsheets that demonstrated the power of compound interest. The spreadsheets also demonstrated the affect of various monthly investment amounts over a range of years and growth rates.
A key to making the whole thing work was getting their consent and commitment to making no attempt at withdrawing money from the accounts and allowing me to managing them.
In the end, I selected a stock, Hasbro (HAS), and added that stock to my own DRIP account. Then I filled out transfer forms for each of my kids. Next, I visited them in Texas and explained the Excel spreadsheets, DRIP accounts, and my plan to buy stock with their birthday & Christmas money.
Having secured their commitments to not mess with the accounts until after my death, they signed the transfer forms.
I mailed the transfer forms to Computershare, the Hasbro transfer agent. A few weeks later I received confirmation from Computershare that one share of HAS stock had been successfully transferred to each of the kid’s DRIP accounts.
Finally, I set up accounts in the kid’s names on the Computershare web site.
Execution
The accounts were now set up. My plan was ready to execute. I took the remainder of my birthday & Christmas budget and spread it out over the following year in $25 dollar increments; dollar-cost averaging into Hasbro stock.
Twice a year, May & December, I send the kids an activity statement showing the investments made and the current account value.
During the second year I added another stock and in the third year I added a third stock. The total annual investments remain the same. I just allocate the investments to different stocks at different times. I don’t have an automatic monthly investment set up. I manually prepare each one and use an Outlook task reminder to schedule investments and to keep me on budget.
The next time I visit them in Texas, I plan to review those Excel spreadsheets with them again - including the actual results from their DRIP accounts. I hope to encourage them to start putting a little of their own money into the DRIP or into their own Roth IRA account.
In the next post I’ll take a close look at administering a DRIP account after the initial set up.
Link to Topics in the Special Report - How to Get Rich Slowly DRIP by DRIP
Thursday, November 18, 2010
How to Get Rich Slowly DRIP by DRIP: Gifts to Children
For your own investments you have many choices besides DRIP accounts. Starting with an employer-sponsored 401k plan and including Traditional and Roth IRA accounts available from just about every financial institution of any type. Even life insurance and annuity contracts are investment options.
However, for your grandson or your niece your choices are limited. The amount of money you can afford to invest for them is also likely more limited. The limitations make DRIP accounts an attractive choice.
With a series of one-time investments of $25.00 in any month you can invest annual amounts ranging from $25.00 to $300.00. Of course, you can invest significantly more than $300.00 a year. But the more money you can commit to the child’s investment the more investment choices you have.
DRIP’s are perfect for the grandparent of modest means. With low periodic contributions completely under your control, you can make a huge difference in a child’s financial outcome.
Accounts for minor children can be set up as “custodial” accounts. For adult children they can be set up in the name of the adult child and, with the cooperation of the adult child, managed by you – the contributor.
In the next post I’ll review the DRIP accounts I set up for my adult children.
Link to Topics in the Special Report - How to Get Rich Slowly DRIP by DRIP
Wednesday, November 10, 2010
How to Get Rich Slowly DRIP by DRIP: Asset Allocation
Asset Allocation and rebalancing are disciplines that force you to “buy low and sell high” without trying to time the market. For them to work you must be invested in two or more uncorrelated products (investment vehicles) – preferably negatively correlated (meaning that when one goes up the other goes down).
The Limits of DRIP Asset Allocation
DRIP investments are essentially limited to large-cap dividend-paying stocks, with a few international ADR’s and a few mid-cap stocks thrown in for flavor. Because of this limitation, diversification of asset classes is a matter of selecting dividend-paying stocks from different industries and countries.
My Diversification Plan
Currently, my DRIP portfolio contains:
1. HAS (Hasbro) – an American toy company
2. SJM (J M Smucker) – an American food company
3. CTL (CenturyLink) – an American telephone company
4. JNJ (Johnson & Johnson) – an American pharmaceutical & medical equipment company
I’m also planning to add:
5. BHP (BHP Billiton) an Australian mining company.
6. A suitable non-US oil & gas company.
My portfolio is reasonably diversified across industry sectors. However, it could be improved by the addition of an industrial like Nucor (NUC), a defense company like General Dynamics (GD), a utility like NextEra Energy (NEE), and a financial like Cincinnati Financial (CINF).
The Main Weakness of My Portfolio
My portfolio’s main weakness is its concentration in American stocks. This is an historical accident. As I learned more, I added to the portfolio. Plus, my primary Transfer Agent, Computershare, sponsors few international choices. BHP Billiton is offered thru Wells Fargo Shareholder Services. It’ll be my 1st foray into alternative DRIP Transfer Agents.
If I eventually add more companies to the planned 6-stock portfolio, I’ll focus on international companies. However, there’re some US based companies, like Coke (KO) that receive more than 70% of their revenue from outside of North America. I’d count them as international even if they’re headquartered in the US.
Assign Asset Allocation Percentages
Once a DRIP portfolio has been acquired, or perhaps chosen in advance, it’s time to decide what portion of the portfolio will be targeted for each stock and ADR. A simple even distribution works just fine. For example, if you have a five-stock DRIP portfolio you might assign a target of 20% of the total market value to each of the five stocks.
There’re no rules for this percentage allocation. It depends entirely on how you feel about the relative risk and return of each investment. You may consider your utility stock to be the safest investment and chose to allocate a higher percentage of the portfolio value to it. And, you might decide that your integrated oil company stock is certain to appreciate as oil supplies become more expensive world-wide. If so, your asset allocations might be 35% in the utility, 35% in the integrated oil and 10% in each of the other three stocks.
Again, there’re no rules except the ones you make. However, once made, change the rules seldom or the benefit of rebalancing will be lost.
Portfolio Rebalancing
Selling DRIP stocks is much harder and more expensive than buying them. That’s good. It encourages you to choose carefully, buy consistently, and hold your stocks for a long time. However, it also limits your flexibility in rebalancing your DRIP portfolio.
Your primary method of rebalancing is to allocate new money to stocks that are below their target values leaving those above their targets alone. This makes rebalancing take longer – spreading it out over a number of months of continuous investment.
Most financial advisors recommend rebalancing a portfolio every year. Some recommend every other year. Others advise watching the portfolio every month but rebalancing only when it gets out of balance by more than 15% or 20%.
The differences in advice are largely due to different approaches to getting the most benefit from the “buy low & sell high” discipline. Letting a “hot” investment run far enough to capture a significant gain before taking the gain is always a tradeoff with the timing of when the “hot” investment will cool.
Market timing being something few people can pull off consistently, you must establish a rule for when you’ll rebalance. Once established, this rule must be adhered to and seldom changed. Or, once again, you’ll lose the benefit of the rebalancing discipline and be no more successful at timing the market than the rest of humanity.
To Sum Up
1. Select a diversified portfolio of DRIP stocks & ADR’s based on industry and country.
2. For each stock choose a target allocation (a percentage of the portfolio value) and change the targets reluctantly.
3. Decide when, or under what conditions, you’ll rebalance your DRIP portfolio back to the target allocation percentages.
4. Execute the rebalancing as planned by redirecting your new monthly investments until the target allocations are restored.
The next topic will be using DRIP’s as gifts to children – or grandchildren.
Link to Topics in the Special Report - How to Get Rich Slowly DRIP by DRIP
Thursday, November 4, 2010
How to Get Rich Slowly DRIP by DRIP: Diversification in a DRIP
Purposes
The purpose of a DRIP (Dividend ReInvestment Plan) is:
1. To growth your net worth with a combination of capital appreciation and reinvested dividends.
2. To supplement your income with a dividend stream that increases faster than inflation.
3. To do these things with minimum transaction costs.
The purpose of diversification is to reduce the risk to your net worth of a failure of any one investment or of a secular decline in any one asset class.
Limits of Diversification
These purposes restrict your investment choices to dividend-paying common stocks and ADR’s (American Depository Receipts). In practice, you’re also restricted to “large-cap” stocks; companies with a total market capitalization of more than $10 Billion. Market capitalization means the market value of all of the shares held by all shareholders.
Unfortunately, few mid-cap and small-cap stocks support DRIP’s.
In addition, I’m restricting myself to DRIP’s with minimum follow up investments of $50 per transaction or less; with a strong preference for $25 or less.
Consequently, the opportunity to diversify your DRIP holdings is limited. You can, however, choose to set up DRIP’s with companies in different industry sectors and from different countries.
My Diversification Plan
Currently, my DRIP portfolio contains:
1. HAS (Hasbro) – an American toy company
2. SJM (J M Smucker) – an American food company
3. CTL (CenturyLink) – an American telephone company
4. JNJ (Johnson & Johnson) – an American pharmaceutical & medical equipment company
I’m also planning to add:
5. BHP (BHP Billiton) an Australian mining company.
6. A suitable non-US oil & gas company.
Ideal Portfolio Size
I think a DRIP portfolio of from 5 to 10 stocks is ideal. More than that would be cumbersome – you’d be better off using a brokerage account.
Less than 5 is okay – especially at first. But, I think your intention should be to diversify over time. It really doesn’t require more money to diversify your DRIP portfolio. You just have to allocate where your monthly investment money goes. For example, if you have only $25 per month to invest, you can invest in a different stock each month or each quarter or each year. You’ll end up with fewer shares of each stock but with the same investment stream you can have a five stock portfolio instead of just one.
Speaking of allocating your investments – the next post will cover Asset Allocation in your DRIP portfolio.
Link to Topics in the Special Report - How to Get Rich Slowly DRIP by DRIP
Friday, October 29, 2010
How to Get Rich Slowly DRIP by DRIP: What's Dollar-Cost Averaging Got to do with It?
Dollar-Cost Averaging is a fancy term for a series of regular equal value investments into the same product over an extended time regardless of the product’s changing price.
Generally, people make equal periodic investment purchases for their own convenience; they match their buys with their employer’s payroll cycle. People with 401k plans, including me, are almost always dollar-cost averaging into their 401k investments for example.
So what? Who cares?
Virtually no one can successfully time the market over a long period. You can’t always correctly predict the price of your chosen investment in order to buy when it’s low and sell when it’s high.
Since you really don’t know which way the market will go in the near term, if you make a single lump-sum investment you may accidentally buy just before the price goes up. You may also buy just before the price crashes.
One reason to Dollar-Cost Average is to reduce the price direction risk of a fixed dollar investment. Spread your $10,000 lump-sum investment as 10 monthly investments of $1,000 each and you'll find the entry prices of each of the 10 investments are different. Some are higher and some lower than the first purchase.
The hope is that your average price is better than your single lump-sum price would've been.
Happiness is a Volatile Share Price
But, there’s another advantage of long term Dollar-Cost Averaging – the kind available thru monthly DRIP account purchases. The Excel workbook below shows the number of shares that would be purchased and their value if equal annual investments were made in a DRIP over 25 years with all dividends reinvested. It also assumes that the DRIP stock increases in value at a consistent 6% rate every year.
6% Constant Annual Earnings Per Share Growth
After 25 years of $600 annual investments the investment grows to $63,563.21 with 448.54 shares in the account at a presumed market price of $141.71 per share. The sum of the annual investments is only $14,994.05 – a pretty good return overall.
The next Excel workbook shows an example of what happens in reality. The stock price doesn’t grow steadily every year. Instead it bounces around. Sometimes up. Sometimes down. But, in the end, it reaches the same price - $141.71 per share.
6% Average EPS Growth with Volatility
The difference is each annual $600 investment buys either more shares or less as the share price fluctuates.
The example has 6% average annual growth but with fluctuations of 18.12% up or down around the average. The result is an ending value of $77,916.60 with a total of 549.83 shares in the account.
Try it for Yourself
Obviously, I forced the ending share price to be the same by tweaking the fluctuation percentage. You can change the parameters in the workbook to see how different values of average growth or the volatility (fluctuation percentage) affect the outcome. But the typical case is that volatility, as long as some of it takes the price below the average increase curve, will result in more shares held in the end.
That’s why Warren Buffet says to be happy when share prices fall – Mr. Market is just holding a sale!
The next post will take up the idea of “diversification” in DRIP accounts.
Link to Topics in the Special Report - How to Get Rich Slowly DRIP by DRIP
Thursday, October 21, 2010
How to Get Rich Slowly DRIP by DRIP: Transaction Costs Compared to Mutual Funds
You pay less for the privilege of investing in a DRIP account compared to mutual funds. Paying less means more of your money works for you - increasing your net worth.
The transaction costs for HAS (Hasbro), a typical DRIP stock, were discussed in the previous post. Hasbro’s fee schedule is reproduced below.
Example Fee Schedule
The fee structure for Hasbro (HAS) is:
The transaction costs for HAS (Hasbro), a typical DRIP stock, were discussed in the previous post. Hasbro’s fee schedule is reproduced below.
Example Fee Schedule
The fee structure for Hasbro (HAS) is:

DRIP vs Mutual Fund – Head to Head
In the following Excel spreadsheet you can see the effect of equal investment streams going into a DRIP account compared to a no-load mutual fund with zero brokerage commissions, a 1% annual management fee, 4% reinvested dividend yields, and 6% annual net asset value (NAV) growth. These are pretty decent numbers for a mutual fund. Few have done this well over any significant time period.
After 25 years the mutual fund’s value grows to $56,609.17. The same investment stream in a DRIP grows to $64,858.64 – a difference favorable to the DRIP of $8,249.47; A much larger difference than buying individual stocks thru a broker.
Why? Because the 1% management fee is 1% of the entire value of the investment – every year. Brokerage commissions are incurred only when you buy or sell. Frequent trading will cause commissions to mount up fast. But, if you hold high quality stocks for the long term commissions are insignificant.
What If?
This example is designed to be favorable to the mutual fund. Few mutual funds yield 4% dividends and few have management fees as low as 1%. Only index funds are that efficient and not all of them.
You can change the parameters in this spreadsheet.
Experiment with different commission fees, dividend yields, EPS growth rates or annual investments and see how they affect results. For example, changing the annual management fee to 0.5% reduces the difference to just $3,086.64 – still much more than when DRIPs are compared to buying and holding stock thru a broker.
The topic of the next post is Dollar-Cost Averaging.
Link to Topics in the Special Report - How to Get Rich Slowly DRIP by DRIP
Tuesday, October 12, 2010
How to Get Rich Slowly DRIP by DRIP: Transaction Costs Compared to Brokerages
You pay less for the privilege of DRIP account investing compared to using a broker – or mutual funds, but that’s another post.
Paying less to play means more money goes into your investment - increasing your net worth.
You buy stocks for your DRIP plan directly from the stock issuing company. The “Transfer Agent” merely administers the transactions. This means each DRIP plan can have a different fee structure. Some plans charge fees for purchases, some discount the purchase price from the current market price. All charge a fee when you sell.
Example Fee Schedule
The fee structure for Hasbro (HAS) is shown below.

HAS doesn’t allow buying the initial investment thru the plan administrator (Transfer Agent). You must transfer at least one share from your broker or mail an actual stock certificates to set up the account. As shown in the table above, there’s no fee to set up the account.
After the account is set up you can buy additional shares thru the Transfer Agent without fees. If you buy shares thru a broker you will pay a brokerage commission with each transaction. As a point of reference, my transaction costs thru my broker are $5.95 per transaction.
DRIP’s Aren’t for Trading
My broker charges the same $5.95 per transaction whether I’m buying or selling. You can see in the chart that Hasbro charges $10.00 per transaction PLUS $0.15 per share when you sell. So if I sold all of my HAS shares – assuming I owned 100 shares – my DRIP selling cost would be $10 + $15 (100 shares * $0.15/share) = $25 compared to only $5.95 if I sold the same 100 shares thru my broker. DRIP accounts are not for trading.
If you accumulate shares in your DRIP and hold them for the long term, the DRIP is very efficient in terms of transaction costs. None are charged on your monthly purchases. If I bought shares monthly thru my broker I’d pay $71.40 a year compared to zero in my DRIP. The higher DRIP selling fee is overwhelmed by the commissions charged on regular purchases of stock thru a broker.
DRIP vs Brokerage – Head to Head
In the Excel spreadsheet below you can see the effect of equal investment streams going into a DRIP account compared to a brokerage account given $5.95 brokerage commissions, 4% reinvested dividend yields, and 6% annual growth in earnings per share (EPS).
After 25 years the Brokerage investment stream grows to a value of $64,279.42. The same investment stream in a DRIP grows to $64,858.64 – a favorable difference to the DRIP of $579.22. Not much over 25 years.
What If?
This example, however, is designed to be extremely favorable to the brokerage account. There’s no trading and the buys are lumped into annual purchases of $600 each. In the DRIP, the annual $600 investment could be monthly purchases of $50 each – still with zero transaction costs. An equivalent investment stream in the brokerage account would reduce the value of the account to $57,197.38 – a favorable advantage to the DRIP of $6,950.58.
You can change the parameters in this spreadsheet.
Experiment with different commission fees, dividend yields, EPS growth rates or annual investments and see how they would affect results
In the next post, I’ll compare DRIP account investments to mutual funds. I think the results will surprise you.
Link to Topics in the Special Report - How to Get Rich Slowly DRIP by DRIP
Wednesday, October 6, 2010
How to Get Rich Slowly DRIP by DRIP: How to Reinvest Your Dividends
Adding the power of compounding dividends, regular dividend increases and appreciating share value will produce a much higher investment value over many years. I strongly recommend you reinvest your dividends – at least until you need them for income.
The Computershare web site isn’t the friendliest. But setting up your Computershare DRIP account to automatically reinvest dividends is easy despite awkward site navigation.
The embedded slide presentation contains instructions to will help you avoid minor inconveniences I’ve run into on http://www.computershare.com/.
Transaction costs are the subject of the next post.
Link to Topics in the Special Report - How to Get Rich Slowly DRIP by DRIP
Friday, October 1, 2010
How to Get Rich Slowly DRIP by DRIP: Why Should You Reinvest Your Dividends?
Well, why SHOULD you reinvest your dividends?
You could take your dividend money in cash and spend it. And, one day you will want to do just that. I plan to use future dividends as a major source of retirement income.
But until then, my dividends are reinvested.

Dividend Growth Stock
A well chosen dividend growth stock has demonstrated its ability to grow earnings per share and therefore - over time – its share value. It’s also increased its annual dividend in proportion to earnings growth.
A company may not do in the future what it did in the past; it’s nevertheless more likely to continue such policies than is a company that’s never consistently grown its earnings and dividends.
Compounding Earnings per Share (EPS)
A conservative example of a typical dividend growth stock – perhaps an electric utility – is shown in the chart below.
An original investment valued at $1,000 is assumed; with no additional future purchases. All dividends are assumed paid in cash and used as disposable income.
For simplicity, the normal fluctuations of business are assumed away - at conservative averages. A constant 4% dividend yield is assumed; as is constant annual earnings per share (EPS) growth of 6%. Constant market valuation based on the Price/Earnings Ratio (P/E) would make the value of the investment increase at the same 6% rate of EPS growth. Also, all compounding is shown as annual. Quarterly compounding (the reality) would increase the resulting values in all cases.
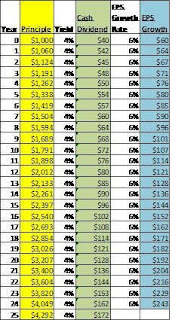
After 25 years of 6% annual growth your original $1,000 investment is worth $4,292 and the you received $2,366 in quarterly dividend payouts. Not bad.
Compounding EPS & Dividends
The next chart uses the same assumptions except instead of spending the dividends; you automatically reinvests them in additional shares of the company’s stock.
Look at what happens to your investment value. Look at what happens to your annual dividends available for retirement income at the end of year 25.
The $1,000 investment has grown to $10,835 and your annual disposable dividend income is $433 – more than twice as much and a nice chunk of change. Congratulations!
Compounding With Monthly Investments
Now what would become of your original $1,000 if you also made additional $25 monthly investments or $300 per year?

After 25 years of adding $25 per month to your investment – a total of $7,500 – your $8,500 (original $1,000 + the additional $7,500) is now worth $40,339. And, your available dividend income is $14,349 per year. Wow!
Getting Rich DRIP by DRIP
Suppose you did that with two or three more stocks – or even five. Suppose you increased your monthly investments as your income grows – say 3% per year.

In the chart above you start out with five $1,000 investments and add $25 per month to each of them. You increase your monthly investments by 3% per year and end up with a total cash investment of $15,938 ($5,000 original investment + $10, 938 in total monthly investments over 25 years).
This produces a value of $91,635. Your dividend income rises to $33,944 a year; all with a very modest commitment.
You can do even better that that – you can get rich DRIP by DRIP.
In the next post I’ll show you how to set up your DRIP account to automatically reinvest your dividends. It’s easy. It’s worth it.
Link to Topics in the Special Report - How to Get Rich Slowly DRIP by DRIP
You could take your dividend money in cash and spend it. And, one day you will want to do just that. I plan to use future dividends as a major source of retirement income.
But until then, my dividends are reinvested.
Dividend Growth Stock
A well chosen dividend growth stock has demonstrated its ability to grow earnings per share and therefore - over time – its share value. It’s also increased its annual dividend in proportion to earnings growth.
A company may not do in the future what it did in the past; it’s nevertheless more likely to continue such policies than is a company that’s never consistently grown its earnings and dividends.
Compounding Earnings per Share (EPS)
A conservative example of a typical dividend growth stock – perhaps an electric utility – is shown in the chart below.
An original investment valued at $1,000 is assumed; with no additional future purchases. All dividends are assumed paid in cash and used as disposable income.
For simplicity, the normal fluctuations of business are assumed away - at conservative averages. A constant 4% dividend yield is assumed; as is constant annual earnings per share (EPS) growth of 6%. Constant market valuation based on the Price/Earnings Ratio (P/E) would make the value of the investment increase at the same 6% rate of EPS growth. Also, all compounding is shown as annual. Quarterly compounding (the reality) would increase the resulting values in all cases.
After 25 years of 6% annual growth your original $1,000 investment is worth $4,292 and the you received $2,366 in quarterly dividend payouts. Not bad.
Compounding EPS & Dividends
The next chart uses the same assumptions except instead of spending the dividends; you automatically reinvests them in additional shares of the company’s stock.
Look at what happens to your investment value. Look at what happens to your annual dividends available for retirement income at the end of year 25.
The $1,000 investment has grown to $10,835 and your annual disposable dividend income is $433 – more than twice as much and a nice chunk of change. Congratulations!
Compounding With Monthly Investments
Now what would become of your original $1,000 if you also made additional $25 monthly investments or $300 per year?
After 25 years of adding $25 per month to your investment – a total of $7,500 – your $8,500 (original $1,000 + the additional $7,500) is now worth $40,339. And, your available dividend income is $14,349 per year. Wow!
Getting Rich DRIP by DRIP
Suppose you did that with two or three more stocks – or even five. Suppose you increased your monthly investments as your income grows – say 3% per year.
In the chart above you start out with five $1,000 investments and add $25 per month to each of them. You increase your monthly investments by 3% per year and end up with a total cash investment of $15,938 ($5,000 original investment + $10, 938 in total monthly investments over 25 years).
This produces a value of $91,635. Your dividend income rises to $33,944 a year; all with a very modest commitment.
You can do even better that that – you can get rich DRIP by DRIP.
In the next post I’ll show you how to set up your DRIP account to automatically reinvest your dividends. It’s easy. It’s worth it.
Link to Topics in the Special Report - How to Get Rich Slowly DRIP by DRIP
Thursday, September 23, 2010
How to Get Rich Slowly DRIP by DRIP: More Follow Up Investments
Do you want to be “an investor” but don’t have the cash? Are you saving for retirement or a trip around the world – but you can’t see how you’ll reach your goal?
A Dividend ReInvestment Plan account (DRIP) – might be the solution.
The Main Thing
The main thing you need to know about DRIP accounts is you can start one for $250.00 or less and make follow up investments as low as $10 to $100.
Follow Up Investment Frequency
After you establish a DRIP you can, if you choose, add money every month or whenever you want – including never again.
When I contribute money to my DRIP it’s held until the next monthly purchase. Computershare, my DRIP administrator, seems to execute purchases between the 18th and the 22nd of the month – regardless of when you send in the money. If you miss their window they just queue it up for the regular purchase time – next month.
Follow Up Investment Fees
Most companies don’t charge fees or commissions to make follow up purchases. They generally do charge fees if you make your initial purchase thru the DRIP administrator instead of transferring shares from a broker. Remember you are buying stock from the issuing company, not from the DRIP administrator.
Example
I contributed $25 via a checking account draft that is set up to occur every month. On 9/15/2010, Computershare bought from Hasbro 0.567924 shares of HAS common stock at a market price of $44.020000 per share. On 9/20/2010 the 0.567924 shares of HAS were credited to my DRIP account.
The exact same thing happens when I send money to a DRIP without the benefit of a regular monthly bank draft. I set up a one-time draft in those cases.
Although writing paper checks is an available option I don’t use that method. I just don’t trust that checks will always get where they’re supposed to go in a timely manner.
Results
In my Hasbro DRIP account I buy $25 worth of HAS stock every month. Because the price varies with the market, I buy a different amount of stock each time.
 The table above shows the monthly purchases of HAS I’ve made starting with my November 2009 purchase. In every case, I bought $25 worth of HAS. You can see that every month I bought a smaller fractional share beginning with 0.849615 shares and ending with my most recent purchase of 0.567924.
This is a “good news/bad news” situation. I’m buying fewer shares for my $25 because the share price is going up – significantly. Because the stock price is going up, the value of my account is going up too. However, my monthly $25 buys fewer shares.
This Is Real
This really works. I set up my HAS account by transferring shares from my broker. I could’ve bought a single share thru my broker. If I did, my cost structure would’ve looked like this.
In October 2009, the market value of one share of HAS was $29.42. If I’d just opened the brokerage account and didn’t qualify for any commission discounts, the commission on a one share purchase would have been $19.95; so, $49.37 would’ve been my initial startup cost.
$29.42 + $19.95 = $49.37.
I didn’t buy just one share and the commission I paid was lower. The startup cost is hypothetical. But, the chart below shows the reality of my recent experience adjusted for the initial purchase of one share at a maximum commission rate. This is a real life example of what can happen with a DRIP.
 Hasbro has did very well in the twelve months shown. My Hasbro DRIP has been open for two years and it’s done even better. Not every stock will do as well. Hasbro may never do as well again. But a DRIP can put you in the stock market at a very low cost.
Remember that DRIP means Dividend ReInvestment Plan. I haven’t yet mentioned dividends. That’s for next time.
Link to Topics in the Special Report - How to Get Rich Slowly DRIP by DRIP
Thursday, September 16, 2010
How to Get Rich Slowly DRIP by DRIP: Follow Up Investments
Do you want to be “an investor” but you don’t have the cash? Do you want to save for retirement or a trip around the world – but you can’t see how you’ll reach your goal?
If you answered “yes”, a DRIP account – a Dividend ReInvestment Plan account – might be the solution.
The Main Thing
Here’s the main thing you need to know about DRIP accounts – you can start one for $250.00 or less with minimum follow up investments of between $10 & $100.
After you establish the account you can, if you choose, add money once a month.
Automatic Monthly Investments
Computershare, the DRIP account administrator for my accounts, offers an automatic bank draft for your regular monthly investments. I use this feature for two of my three accounts, HAS (Hasbro) & CTL (CenturyLink). Both companies require minimum follow up investments of $25 - I investment the minimum each month.
Infrequent At Will Investments
In my third DRIP account, SJM (JM Smucker), I occasionally make a follow up investment. Follow up’s can’t be more frequent than once a month – I add money far less often.
Bank Drafts vs. Mail-In Checks
You can still use the bank draft system even if you aren’t making regular monthly investments. Or, you can mail-in paper checks with the convenient “deposit” form provided by Computershare with the monthly account statement.
More - follow up investment information - to come in the next post.
Link to Topics in the Special Report - How to Get Rich Slowly DRIP by DRIP
Monday, September 13, 2010
How to Get Rich Slowly DRIP by DRIP
Links to Topics in the Special Report: How to Get Rich Slowly DRIP by DRIP
DRIP by DRIP: Introduction
DRIP by DRIP: The Initial Investment
DRIP by DRIP: Follow Up Investments
DRIP By DRIP: More Follow Up Investments
DRIP by DRIP: Why Should You Reinvest Your Dividends?
DRIP by DRIP: How to Reinvest Your Dividends
DRIP by DRIP: Transaction Costs Compared to Brokerages
DRIP by DRIP: Transaction Costs Compared to Mutual Funds
DRIP by DRIP: What's Dollar-Cost Averaging Got to do with It?
DRIP by DRIP: Diversification in a DRIP
DRIP by DRIP: Asset Allocation
DRIP by DRIP: Gifts to Children
DRIP by DRIP: Gifts to My Children
DRIP by DRIP: Set Up for Dividend Reinvestment
DRIP by DRIP: Set Up a One-Time Investment
DRIP by DRIP: Transaction History
Link to the Special Report: Dividends
Dividends - Part 1 - Introduction
Thursday, September 9, 2010
How to Get Rich Slowly DRIP by DRIP: The Initial Investment
Do you want to be “an investor” but you don’t have the cash? Do you want to save for retirement or a trip around the world – but you can’t see how you’ll reach your goal?
If you answered “yes”, a DRIP account – a Dividend ReInvestment Plan account – might be the solution.
The Main Thing
There’s a lot to learn about DRIP accounts. I’ll go there later. But here is the main thing you need to know – you can start one for $250.00 or less with follow up investments in some cases as low as $10 per purchase.
In my DRIP account I currently have three stocks, Hasbro Corp (HAS), CenturyLink (CTL), and JM Smucker (SJM).
Transferring Stock
When I opened the HAS account I bought shares through an on-line brokerage house and transferred one share from the brokerage to the DRIP plan administrator, Computershare.
As I write this, HAS closed the trading day at a price of $43.05 & CLT closed at $36.47. On-line brokerage houses have different commission schedules ranging from as low as $4.00 per trade to as high as $20.00 per trade. Worst case – you could today open a Hasbro DRIP for $63.05 ($43.05 stock price + $20.00 commission) and a CenturyLink DRIP for $56.47 ($36.47 stock price + $20.00 commission).
Transferring the stock from the brokerage to Computershare must be done by the brokerage house. In my case, I wrote a letter to my brokerage, USAA Brokerage Services, instructing them to send one share of HAS to Computershare. In the letter I provided my brokerage account number, my home address, the number of shares to transfer, and the address and phone number of Computershare.
After about a week the transaction was complete. One share of HAS appeared in my new DRIP account at Computershare.
One thing surprised me the first time thru this process. Computershare did ALL of the account set up after receiving the stock certificate from USAA. They wouldn’t do any preliminary set up although I asked them to.
Direct Buy
When I set up the account for JM Smucker (SJM) I made the initial purchase thru Computershare. Some companies that offer their shares thru DRIP account administrators allow direct purchase of the initial investment - but many don’t. For those that don’t you must set up the account by transferring at least one share as described above.
For SJM though, I set up a purchase using the Computershare web site for the minimum allowed initial investment of $250.00. When the transaction was processed (they process buy orders once a month) the price of SJM was $54.904952 and they charged a transaction fee of $11.93. This netted me 4.336039 shares of SJM.
Yes, they sell fractional shares & yes, they priced the shares to six decimal places.
The actual fee schedules are complicated and they’re different for every company. You’re actually buying shares of the company from the company. In my case I bought 4.336039 shares of JM Smucker (SJM) directly from JM Smucker. Computershare merely facilitated the transaction and now holds the shares on my behalf.
Because you buy directly from the share-issuing company, each company sets their own rules for how the transaction is handled and how much it costs.
In my next post I’ll review follow up investments. In the cases of HAS, CTL, and SJM the minimum follow up investment is $25.00.
The Main Thing
At Computershare the minimum follow up ranges from $10.00 to $100.00 per transaction. But you can already see that a Hasbro DRIP account can be started for $60 to $70 or less (depending on the current price per share & your specific brokerage commission). And, follow up investments in HAS can be as little as $25.00.
Get Rich Slowly
$25 per month doesn’t sound like much, but over 30 or more years of stock price appreciation combined with compounded reinvested dividends – you can get rich slowly.
Link to Topics in the Special Report - How to Get Rich Slowly DRIP by DRIP
Thursday, September 2, 2010
How to Get Rich Slowly DRIP by DRIP: Introduction
Would you like to be “an investor” but you just don’t have the cash? Are you trying to save money for retirement, for a dream home, for a child’s education, for a trip around the world – but you can’t see how the little bit you’re saving each month will ever allow you to reach your goal?
If you answered “yes” to any part of these questions, a DRIP account – a Dividend ReInvestment Account –may be just what you need.
In the series to follow, I’ll discuss DRIP accounts in detail. I hope some of you will decide, as I did, that DRIP accounts are wonderful things; that they deserve a place in your financial plan.
I’ll point out the advantages & disadvantages of investing thru DRIP’s and I’ll provide instructions on how you can set one up.
Below are the main DRIP account topics I’ll explore:
· Inexpensive – zero or very low transaction costs
· Automatic Dividend re-investment
· Low initial investment
· Low minimum follow up investments
· Automatic monthly investments – debit checking or savings account
· Dollar-Cost Averaging
· Compounding
· Gift to children – minor or adult
· Difficult to set up
· Easy to administer after initial set up
· Limited investment choices
· Difficult to move between investments
· Manage thru allocation of new money
· Step by Step thru the set up process
· Step by Step thru the monthly purchase process
· DRIP Plan Administrators
· DRIP Plan Investment Choices
· DRIP vs DSPP
I urge you to follow along as I present the attributes of Dividend ReInvestment Accounts. I believe this investment vehicle deserves far more attention that it gets. It’s truly a way to “Get Rich Slowly”.
Link to Topics in the Special Report - How to Get Rich Slowly DRIP by DRIP
Link to the Special Report: "Dividends"
Thursday, August 26, 2010
When to Sell: Reasons to Sell that are Unrelated to the Stock
When should I sell stock I bought as an investment?
At heart, I’m a “dividend growth” investor. So, logically, when a stock ceases to be a dividend growth stock I should sell it. But, economic cycles and temporary misfortunes don’t necessarily turn a good company bad. So, under what conditions should I decide that a formerly good dividend growth stock has ceased to be one?
In my previous two posts I identified four analytical criteria and three qualitative reasons I’ll use to make that decision. But there are other reasons I‘ll consider selling that are unrelated to a specific stock.
H. I’ll sell when I believe there is a market crash or a significant correction pending and I want to preserve my capital for reinvestment at substantially lower prices.
This happened in 2008. Although I was slow to recognize the crash, I did manage to sell everything I wanted to sell about 30% into the downward leg. I started buying again near the bottom and continued buying until the Dow approached 11,000. This enabled me in 2009 and 2010 to more than make up for my 2008 losses.
I believe we are on the verge of repeating the crash. Consequently, over the past weeks I’ve sold most of my equity positions so I’ll be prepared to start buying again when the market is 20% to 30% lower.
I don’t know how to time the market better than anyone else. But I’m convinced that the current economic “recovery” is phony and more importantly – it’s over. I’ve no idea where the bottom will be. That’s why I’ll start buying when the market is 20% to 30% down and I’ll continue buying a little at a time while events play out.
I hope to “dollar cost average” the market bottom and “bracket it” in field artillery terms.
I. I’ll sell my weakest investments when I need cash to invest in a much better opportunity.
When I identify a strong new investment opportunity and I have insufficient cash available to purchase it, I’ll chose one or more of my least attractive current positions to sell. Using the proceeds of the sale, I’ll buy the new stock.
In practice, I’m never fully invested. I maintain a cash reserve in case an extraordinary opportunity presents itself. However, if my reserve is at my minimum target value, I’ll still sell my weakest investments to raise additional cash for the new stock.
Since the recent rally peaked, I’ve steadily increased my cash reserve in preparation for the expected downturn. As my target cash reserve figure increased, there have been multiple occasions when I sold weaker investments to purchase stronger ones.
J. I’ll sell my weakest investments if an emergency situation requires more cash than I have available.
If a family disaster occurs selling investments could become necessary. However, my wife & I maintain emergency accounts as well as insurance that we hope will prevent this situation.
Retirement Income
Most people would include generating income in retirement as a reason to sell stocks; not me. I buy only dividend stocks and I plan to use only the dividends as retirement income. I’ll let the stocks appreciate over time and continue increasing their annual dividend payouts.
Summary of the Reasons I Will Sell Stocks
A. The company stops paying a dividend.
B. The stock’s price increases such that the dividend yield falls below 2% and the P/E ratio rises above 25.
C. The company’s earnings decline enough that the dividend payout ratio exceeds 100%.
D. The stock’s “Financial Score” is a negative number.
E. The company’s survival is threatened by a very large legal liability.
F. The company enters into a major merger agreement.
G. The stock’s total return falls below 10%.
H. I’ll sell when I believe there is a market crash or a significant correction pending and I want to preserve my capital for reinvestment at substantially lower prices.
I. I’ll sell my weakest investments when I need cash to invest in a much better opportunity.
J. I’ll sell my weakest investments if an emergency situation requires more cash than I have available.
I hope you find this series of posts on “When to Sell” interesting. Writing it has clarified my thinking about selling stock. For me, it was a profitable exercise.
Link to Topics in the Special Report: "When to Sell"
Thursday, August 19, 2010
When to Sell: More Reasons to Sell a Stock
When should I sell stock I bought as an investment?
At heart, I’m a “dividend growth” investor. So, logically, when a stock ceases to be a dividend growth stock I should sell it. But, economic cycles and temporary misfortunes don’t necessarily turn a good company bad. So, under what conditions should I decide that a formerly good dividend growth stock has ceased to be one?
In my previous post I identified four criteria I’ll use to make that decision. But there are other, less analytical, reasons I may consider selling such as:
E. The company’s survival is threatened by a very large legal liability.
The BP oil spill in the Gulf of Mexico springs to mind; as do Toyota’s recent multiple recalls. In the case of BP I actually did sell when it looked to me that the magnitude of BP’s growing potential liability could bankrupt the company.
I sold my BP shares at a 10% loss and ended the transaction a happy man. I didn’t own Toyota so, I don’t know if I would’ve sold my position or doubled down when the second recall was announced. By the time of the fourth recall, however, I’m pretty sure I’d have bailed.
F. The company enters into a major merger agreement.
I own shares in CenturyLink (CTL) and I’m very happy collecting its big dividends every quarter. Nevertheless, when CenturyLink announced its pending merger with Qwest I immediately started thinking of cashing out my entire position.
Without any details of the planned merger, I anticipated that Qwest was buying CenturyLink. But, when I read the information packet sent to shareholders I was pleasantly surprised to discover CenturyLink is buying Qwest, and for small fractional shares of CenturyLink for each share of Qwest.
I’m still a little concerned that the merger might screw up CenturyLink’s future dividend increases. But, I think the odds are that CenturyLink will continue to grow its payout as a result of the merger. So, although I certainly considered selling, in the end I chose to retain my CTL shares.
Last year ExxonMobil (XOM) entered into an agreement to buy XTO Energy (XTO). XTO was one of my favorite and most profitable holdings at the time and I was sorely disappointed at the announcement. I didn’t hesitate to pull the trigger on XTO, however. I sold my shares within the week. XTO was going away and there was no help for it.
G. The stock’s total return falls below 10%.
I recently sold my positions in several stocks because my projection of their total return was less than 10%. I estimate total return by adding the current dividend yield to the five year earnings growth rate (earnings not earning per share).
I nearly sold my Johnson and Johnson (JNJ) stock for the same reason. But, it’s such a good dividend payer that I haven’t yet been able to pull the trigger on that sale. I certainly considered it though.
As you can see, these three additional reasons to sell are not as conclusive as the previous set. They are, however, reasons I consider valid. They will cause me to consider selling.
Next, I’ll review reasons to sell stock that are unrelated to the specific company,
Link to Topics in the Special Report: "When to Sell"
Friday, August 13, 2010
When to Sell
Links to Special Topics in the Discussion of "When to Sell" a "Dividend Growth Investment
When to Sell: What Are the Right Reasons?
When to Sell: Why Did I Sell?
When to Sell: When Should I Sell?
When to Sell: More Reasons to Sell a Stock
When to Sell: Reasons to Sell that are Unrelated to the Stock
When to Sell: What Are the Right Reasons?
When to Sell: Why Did I Sell?
When to Sell: When Should I Sell?
When to Sell: More Reasons to Sell a Stock
When to Sell: Reasons to Sell that are Unrelated to the Stock
When to Sell: When Should I Sell?
When should I sell stock I bought as an investment?
As I’ve stated in previous posts, at heart, I’m a “dividend growth” investor. So, logically, when a stock ceases to be a dividend growth stock I should sell it.
Economic cycles and temporary misfortunes, however, don’t necessarily turn a good company bad. So, at what point should I stop giving an investment the “benefit of the doubt”? The answer to this question is different for different people.
Traders might place stop loss orders at 10% or 20% below current asking price and revise the orders upward as the stock goes up. The stop loss strategy tracks the sentiment-driven price of the stock, but not its fundamentals.
I’ve already proven that I lack the temperament of a trader. I’m successful with a long term fundamental approach – hence my attraction to dividends.
Along with Warren Buffet, my favorite holding period is forever. So, for me, the point when I’ll give up on an investment is partially answered by the following.
I’ll determine that a stock’s no longer appropriate for my “dividend growth” investment portfolio if:
A. The company stops paying a dividend.
B. The stock’s price increases such that the dividend yield falls below 2% and the P/E ratio rises above 25.
C. The company’s earnings decline enough that the dividend payout ratio exceeds 100%.
D. The stock’s “Financial Score” is a negative number.
As I thought through this partial list of sell signals, I revised my stock analysis workbook to measure them and generate a visible sell signal when they occur.
In my next post I’ll explore further reasons I should sell an investment stock.
Link to Topics in the Special Report: "When to Sell"
Friday, August 6, 2010
When to Sell: Why Did I Sell?
Twenty-three years ago I dabbled in trading individual stocks. It was a lot harder then, before the Internet. I’d read a couple of books on the stock market and investing and I’d made some money earlier investing in a front loaded mutual fund every month for about five years.
So, I thought pretty highly of my investing skills; I was a natural!
I actually did have decent reasoning ability and without training but with eight years of working for General Motors I decided I could ride the cyclical automotive stocks. I looked at the price charts – not the “technical” charts – to see where the stock was relative to its tops and bottoms of the past several cycles.
I bought some GM stock when it seemed below its average price and I sold some when it seemed above its average. And I made a little money.
I bought some Jaguar when it seemed low. And, I got really lucky when Ford tendered for Jaguar. I sold my stock to Ford for a very nice profit.
Then I bought some Western Union when it seemed low – but it went lower & I bought some more. Then it went to zero and I lost my entire investment.
It wasn’t too bad though. I sold my remaining position in GM and overall I broke even on two years of trading. I learned that I wasn’t, after all, a natural.
During this period I sold because:
a. My stock was near a cyclical top.
b. I received a tender offer.
c. I gave up investing in individual stocks
For many years thereafter, My only investments were in themutual funds of my 401k retirement plan.
Then I discovered Jim Cramer. Say what you will about Jim Cramer, but he says his mission is to get people interested in stock market investing and that’s exactly what he did for me. I started trading a little bit based on things he said on his television program.
In 2005, I made a little money overall. I also discovered that Cramer’s relatively short holding periods of one to three months simply didn’t work for me. And, I started to diverge for his teachings.
By 2007 I’d converted my Traditional IRA and my Roth IRA into self-managed brokerage accounts and, along with the much smaller taxable account I started with, I was managing a portfolio containing 30+ stocks – though the total value is and remains quite modest.
I’d discovered long term holding periods and dividends. I was constantly changing my criteria for selecting stocks and with every change I sold stocks that no longer fit with my new thinking.
During this process, I sold because:
d. I made 10% to 20% and wanted to lock in the profit.
e. I lost money and was afraid I’d lose more.
f. The stock seemed to be going no where and I wanted to use the money to buy something else.
By 2008, my stock selection was becoming more of a system; not fully developed but no longer whimsical.
Then, the market crashed. I was heavily invested in dividend paying financials; banks, insurance companies, and business development companies (BDC’s). These stocked started down and at first I bought more.
During a causal conversation with my wife, she suggested that perhaps I should sell my bank stocks. I defended them as being the best bank stocks out there. But, a few days later, recognizing her intuition as better than my own and having no systematic criteria for selling, I sold all of my bank stocks and most of the other financials.
This decision saved my portfolio. Even though I’d already lost money on all of the financial stocks – as well as everything else; I created a cash reserve that I started redeploying as the market bottomed.
As the rally progressed I continued to buy a little bit at a time and I continued to revise my buying criteria. As my criteria changed I sold stocks that didn’t fit my new criteria. I didn’t always sell every stock that didn’t fit. There were a few that I just liked.
Often, during later criteria changes one of the stocks I just liked would again meet my ever changing selection process and I was glad I didn’t sell.
As the rally started to peter out and I came to believe there would eventually be a major correction or another crash, I sold most of the remaining stocks that did not meet my selection criteria.
The frequency and scope of the changes to my evolving system were diminishing. My stock selection process was becoming clearer and my confidence in it were increasing and I decided I needed, once again, to build up a cash reserve so money will be available to redeploy when the market tanks.
That’s where I’m at as I write this piece.
In this most recent phase I sold because:
g. My wife’s intuition suggested I should.
h. My criteria for selecting stocks as investments changed.
i. To rebuild a cash reserve in order to take advantage of an anticipated market downturn.
These are the reasons I’ve sold in the past. Now why should I sell in the future?
Link to Topics in the Special Report: "When to Sell"
Friday, July 30, 2010
When to Sell: What Are the Right Reasons?
Books, newsletters, and seminars use millions of words teaching people how to select stocks and when to buy them. Selling is largely ignored or given lip service. I haven’t actually counted the words but in several investing books I own I can find references to selling in only about 10 of the 200+ pages.
This figure actually overstates the sell/buy ratio since each of the 10 pages containing references to selling stock has only a few lines about selling – roughly 10% of the page. 10% of 10 pages is one page equivalent out of 200+; less than 0.5% of the total pages.
Yet selling is just as important as buying. After all, for every share bought by someone that same share is sold by someone else – every time.
People sell stock for all sorts of reasons. Such as:
(1) Fear of losing money when the investment or the market is going down.
(2) Fear of losing money based on intuition.
(3) To lock in profits that seem “too high” or “high enough”.
(4) To raise cash for a personal emergency.
(5) To reduce portfolio risk as retirement approaches.
(6) To rebalance a portfolio in accordance with target asset allocations.
(7) Because the investment has risen to a target value.
(8) Because the investment has fallen to a “stop loss” price.
(9) Because the investment is “overvalued” or “fairly valued”.
(10) To raise cash for a “better” investment.
(11) Because their investment advisor recommended it.
(12) To raise cash for living expenses during retirement.
I’m sure there are many other reasons people sell their stock. These are just the ones that come to mind as I write this.
The questions for me are:
(1) Why have I sold stock?
(2) Why should I sell stock?
In the following series I’ll try to find my answers to these questions
Link to Topics in the Special Report: "When to Sell"
Friday, July 23, 2010
What Is Intrinsic Value? – Simplifying the Value Elements
My definition of intrinsic value boils down to “a wonderful company fairly valued”. In previous posts I defined 14 value elements describing what I mean by that phrase. Now I’m looking for a better, simpler way to present the elements & the way I use them.
The 14 Elements Value Elements Are:
(4) Consistent Dividend Increases
(6) The Formula: E(2R+8.5)*Y/4 = Intrinsic Value per share
(9) Business Model I Understand
(10) A Durable Competitive Advantage
(12) Reliable Long term Dividend Income Stream
(13) Increasing Annual Dividends Faster Than Inflation
(14) Expect at least a 9% Total Return Compounded Annually
I use a three level hierarchy to test each stock. In previous posts I explained the 1st Level, the 2nd Level, and the 3rd Level analysis. Summarizing the three levels produces the following.
In the 1st Level a company must:
1. Pay dividends with a current annual yield of more than 2.00%
2. Have current earnings that cover the dividend payments
3. Have a forward looking Price/Earnings Ratio (P/E) of less than 16
4. Be favorably viewed by The Motley Fool CAPS community
In the 2nd Level a company must:
5. Generate expected positive cash returns to me above a 9.0% discount rate
6. Have increased revenues over five years
7. Be reasonably priced by the Ben Graham Intrinsic Value Formula
8. Have a Total Annual Return (growth rate plus dividend yield) greater than 8%
In the 3rd Level a company must:
9. Have superior financial performance; low debt; high cash flow, and high returns on equity & assets
10. Have a long term competitive advantage that I can recognize
11. Have a business model that I can understand
This list isn’t much help. It reduces the number of elements from 14 to 11 but more simplification is needed.
Numbers 1 & 2 can be combined into: Generate useful, reliable, and safe dividends.
Number 4 can be dispensed with. I use it but I also override it on occasion.
Number 3 and number 7 can be combined into: Be fairly valued or better at the current price.
Numbers 5, 6, & 8 can be combined into: Extrapolated earnings & dividends growth indicate market beating returns are likely.
Number 9 can’t be combined or ignored. I’ll have to keep it in roughly its current expression.
Numbers 10 & 11 can be stated in a single sentence as: Have a long term competitive advantage and a business model that I can understand.
My restated elements now become:
1. Generate useful, reliable, and safe dividends.
2. Be fairly valued or better at the current price.
3. Extrapolated earnings & dividends growth indicate market beating returns are likely.
4. Have superior financial performance; low debt; high cash flow, and high returns on equity & assets
5. Have a long term competitive advantage and a business model that I can understand.
I can further shorten them to concepts.
1. Generate useful & reliable dividends.
2. Be fairly valued.
3. Market beating returns seem likely.
4. Demonstrated superior financial performance.
5. Has a strategic competitive advantage and business model I understand.
These then, are my revised & simplified value elements. They accurately represent my criteria for selecting the stocks I buy.
The next question is - when do I sell?
Thursday, July 15, 2010
What Is Intrinsic Value? – 3rd Level Calculations
My definition of intrinsic value boils down to “a wonderful company fairly valued”. In previous posts I defined 14 value elements describing what I mean by that phrase. Now I’m looking for a better, simpler way to present the elements & the way I use them.
The 14 Elements Value Elements Are:
(1) Strong Cash Flow
(2) Strong Earnings Growth
(3) Dividend Consistency
(4) Consistent Dividend Increases
(5) Profitability
(6) The Formula: E(2R+8.5)*Y/4 = Intrinsic Value per share
(7) Good returns on equity
(8) Little or No Debt
(9) Business Model I Understand
(10) A Durable Competitive Advantage
(11) Measure Risk
(12) Reliable Long term Dividend Income Stream
(13) Increasing Annual Dividends Faster Than Inflation
(14) Expect at least a 9% Total Return Compounded Annually
I use a three level hierarchy to test each stock. In previous posts I explained the 1st Level and 2nd Level analysis. In my recent post I reviewed the 3rd Level Data; Now, I’ll take up the 3rd Level calculations & decision criteria.
The essence of the 3rd Level analysis is a deeper look at the company’s financial data and including it in the resolution of the Meta-Parameter introduced in the 2nd Level analysis.
The Meta-Parameter is adjusted by the additional data but the same decision criteria are applied to the revised value.
All 3rd Level data discussed in the previous post are involved in the revision of the Meta-Parameter as are the following elements.
“Cash Flow per EPS” is a simple ratio and equals “Cash Flow per Share” divided by “Earnings per Share” (EPS).
“Inverse Cash Flow Payout Ratio” is similar and equals “Cash Flow per Share” divided by “Annual Dividend”.
Financial Score:
The “Financial Score” aggregates all 3rd Level data elements from the previous post with the two elements above. It’s calculated by:
First, testing the “Business Model” data element; If the value of “Business Model” is less than zero the Financial Score is assigned a value of negative one hundred (-100). If “Business Model” is greater than or equals zero then the calculation continues.
Second, the value of the data element “Inverse Current Ratio” is subtracted from an initial value of zero.
Third, two times the “Debt to Equity” value is subtracted from the interim value.
Fourth, “Cash Flow per EPS” is added to the interim value.
Fifth, “Inverse Cash Flow Payout Ratio” is added to the interim value.
Sixth, “Return on Equity” is added to the interim value.
Seventh, Two times the “Return on Assets” is added to the interim value.
Eighth, “Insider Owners” is added to the interim value.
Ninth, “Competitive Advantage” is added to the interim value producing the final value of the “Financial Score”.
The above calculations are performed on a tab separate from the 2nd Level Analysis tab. The value of the “Financial Score” element is then brought over to the 2nd Level Analysis Tab.
Meta-Parameter Revision:
When 3rd Level Analysis data is available an additional parameter, the “Financial Score Parameter”, is activated in the calculation of the Meta-Parameter value.
“Financial Score Parameter” = 0 if the value of “Financial Score” is less than zero; = 1 if the value of “Financial Score” is greater than or equal to zero; = 2 if the value of “Financial Score” is greater than 2.
The pre-existing Meta-Parameter value is multiplied by the new “Financial Score Parameter”. It's clear that a zero value of “Financial Score Parameter” will drive the Meta-Parameter to zero; a value of one will leave it unchanged and a value of two will double it.
The decision criteria remain the same, so if the revised Meta-Parameter value is greater than or equal to 16 (an arbitrary cut off) the stock passes the 3rd Level Analysis test.
My stock analysis for the buy decision is, for me, a very complicated algorithm. Working through it has helped me refine it, correct some mistakes, and understand it better.
Next, I’ll try to develop a way to summarize it so I can clearly communicate the concepts behind it.
Link to Other Topics in the Get Rich Slowly Report: What Is Intrinsic Value?
Thursday, July 8, 2010
What Is Intrinsic Value? – 3rd Level Data
My definition of intrinsic value boils down to “a wonderful company fairly valued”. In previous posts I defined 14 value elements describing what I mean by that phrase. Now I’m looking for a better, simpler way to present the elements & the way I use them.
The 14 Elements Value Elements Are:
(1) Strong Cash Flow
(2) Strong Earnings Growth
(3) Dividend Consistency
(4) Consistent Dividend Increases
(5) Profitability
(6) The Formula: E(2R+8.5)*Y/4 = Intrinsic Value per share
(7) Good returns on equity
(8) Little or No Debt
(9) Business Model I Understand
(10) A Durable Competitive Advantage
(11) Measure Risk
(12) Reliable Long term Dividend Income Stream
(13) Increasing Annual Dividends Faster Than Inflation
(14) Expect at least a 9% Total Return Compounded Annually
I use a three level hierarchy to test each stock. In previous posts I explained the 1st Level and 2nd Level analysis. Now I’ll take up the final and 3rd Level.
The 3rd Level analysis requires eight additional data elements. Five elements I pick up from The Motley Fool website. I enter the ticker symbol of interest in the search box that appears in the upper right corner of the site and press the “Search” button to the right of the box.
When the company data page appears I select the “Stats” tab located in the middle of the row of tabs just below the company name and description; And, I start collecting data.
Inverse Current Ratio:
With the “Stats” tab displayed I navigate to the “Financial Strength” group on the left side of the page and find the “Current Ratio”. I enter the current ratio in the designated cell of the 3rd Level Data Tab, but I enter it as its inverse; using the formula “=1/(Current Ratio)”.
Debt to Equity:
Two lines below the Current Ratio the “Total Debt/Equity” ratio is found. I copy this value into the “Debt to Equity” cell of my workbook.
Cash Flow per Share:
At the bottom of the left side of the page in the “Per Share Data” group, the value for “Cash Flow” is found. This value is entered in the workbook’s “Cash Flow per Share” cell.
Return on Equity:
On the right side of the page in the “Management Effectiveness” group I find the “Return on Equity” value and copy it into the “Return on Equity” cell of the workbook.
Return on Assets:
Just below the “Return on Equity” data the “Return on Assets” value appears. This value is entered in the “Return on Assets” cell in the 3rd Level Data Tab.
Insider Owners:
I get the “% of Shares Held by All Insiders and 5% Owners” value from the YAHOO! Finance web site under the subtitle “BREAKDOWN” in the upper left quadrant of the page. I enter this value as a decimal fraction in the “Insider Owners” cell in the workbook.
Competitive Advantage:
“Competitive Advantage” is a subjective value from “0” to “5” that I assign based on my understanding of the company’s business and markets.
Business Model:
“Business Model” is a subjective value from “-5 to “+5” that I assign based on how well I think I understand the how the company makes money.
These are the data I need for the 3rd Level analysis. In the next post I’ll review the calculations and decision criteria leading to the final “Buy” or “Reject” decision.
Link to Other Topics in the Get Rich Slowly Report: What Is Intrinsic Value?
Thursday, July 1, 2010
What Is Intrinsic Value? – 2nd Level Calculations – Part 2
My definition of intrinsic value boils down to “a wonderful company fairly valued”. In previous posts I defined 14 value elements that describe what I mean by that phrase. Now I’m looking for a better, simpler way to present the value elements & the way I use them.
The 14 Elements Value Elements Are:
(1) Strong Cash Flow
(2) Strong Earnings Growth
(3) Dividend Consistency
(4) Consistent Dividend Increases
(5) Profitability
(6) The Formula: E(2R+8.5)*Y/4 = Intrinsic Value per share
(7) Good returns on equity
(8) Little or No Debt
(9) Business Model I Understand
(10) A Durable Competitive Advantage
(11) Measure Risk
(12) Reliable Long term Dividend Income Stream
(13) Increasing Annual Dividends Faster Than Inflation
(14) Expect at least a 9% Total Return Compounded Annually
I use a three level hierarchy to test each stock. In previous posts I explained the 1st Level analysis, 2nd Level data collection, & began explaining the 2nd Level calculations continued here.
The remaining 2nd Level calculations screen my previously described results against a minimum standard; they apply weighting factors to rank the survivors. Each result is used to assign a parameter value.
To screen out the results that are below the minimum standard, I set the parameter value to zero. Some parameters are binary – their only possible values are zero or one. Other parameters have possible values greater than one.
When all parameters are multiplied together a meta-parameter is created. If any parameter is zero the meta-parameter is also zero. If all parameters are greater than zero the meta-parameter is relatively higher as more parameter weighting factors are employed. The meta-parameter determines whether or not the stock passes the 2nd Level test.
Parameter values are listed below.
“ScoreParameter” = 0 if Score is less than or equal to 0.5; = 1 if Score is between 0.5 & 30; = 2 if Score is greater than 30
“IRRParameter” = 0 if IRR is less than or equal to 0; = 1 if IRR is greater than zero but less than or equal to 30%; = 2 if IRR is greater than 30% buy less than or equal to 60%; = 3 if IRR is greater than 60%
“NPVParameter” = 1 if NPV is less than or equal to $0; = 2 if NPV is greater than $0 but less than or equal to $100; = 3 if NPV is greater than $100
“CAPSParameter” = 1 if CAPS is less than or equal to 4; = 2 if CAPS is greater than 4 (5 is the only allowable value of CAPS greater than 4)
“AchieversParameter” = 1 if the stock is not listed in the Dividend Achievers index or in the Dividend Aristocrats index; = 2 if it is listed in either or both indexes
“SalesGrowthParameter” = 0 if the Sales Growth Ratio is less than or equal to 1; = 1 if the Sales Growth Ratio is greater than 1 but less than or equal to 2; = 2 if the Sales Growth Ratio is greater than 2
“SafetyParameter” = 0 if the Margin of Safety is less than negative 50%; = 1 if the Margin of Safety is less than 0% but greater than negative 50%; = 2 if the Margin of Safety is greater than or equal to 0& but less than 20%; = 3 if the Margin of Safety is greater than or equal to 20%
“ReturnParameter” = 0 if the Total Return is less than 8%; = 1 if the Total Return is greater than 8% but less than or equal to 20%; = 2 if the Total Return is greater than 20%
“FlagParameter” = 0 if the stock fails (right now) the 1st Level test; = 1 if it passes the 1st Level test
These parameters are multiplied together to produce the meta-parameter. If the meta-parameter is greater than or equal to 16 (an arbitrary cut off) the stock passes the 2nd Level Analysis test.
It’s then subjected to the third and final level of analysis – the subject of the next post.
Link to Other Topics in the Get Rich Slowly Report: What Is Intrinsic Value?
Thursday, June 24, 2010
What Is Intrinsic Value? – 2nd Level Calculations – Part 1
My definition of intrinsic value boils down to “a wonderful company fairly valued”. In previous posts I defined 14 value elements that describe what I mean by “a wonderful company fairly valued”. Now I’m looking for a better, simpler way to present the value elements & the way I use them.
The 14 Elements Value Elements Are:
(1) Strong Cash Flow
(2) Strong Earnings Growth
(3) Dividend Consistency
(4) Consistent Dividend Increases
(5) Profitability
(6) The Formula: E(2R+8.5)*Y/4 = Intrinsic Value per share
(7) Good returns on equity
(8) Little or No Debt
(9) Business Model I Understand
(10) A Durable Competitive Advantage
(11) Measure Risk
(12) Reliable Long term Dividend Income Stream
(13) Increasing Annual Dividends Faster Than Inflation
(14) Expect at least a 9% Total Return Compounded Annually
In each level of my three level stock analysis hierarchy I test potential stock investments against tougher standards. Each level requires additional data and additional calculations. Previous posts covered the data and calculations of 1st Level analysis and the data required for 2nd Level analysis.
The 2nd Level uses significantly more calculations than the 1st. Today’s post will begin to describe them.
2nd Level Calculations
The Excel workbook that is my stock analysis tool automatically recalculates whenever any formula value changes. So, in reality all calculations at the 2nd Level occur simultaneously. But I will describe them one at a time.
(1) “Dividend Yield” (Yield) as a percentage of the current share price is calculated by dividing the current annual dividend per share by the current share price. This is different from the dividend yield in the 1st Level in that I recalculate this yield each time I update the share price - for some stocks daily; for others it could be more than a year between updates.
(2) A numerical “Score” is calculated by multiplying the “Sales Growth Ratio” by the “Net Income Growth Ratio” & the “Dividend Growth Ratio”. The result is forced to zero if the “EPS Dividend Payout” is negative or greater than 100%. It’s also forced to zero if any of the growth ratios are negative. Exceptions are made for Funds and Limited Partnerships.
(3) An “Internal Rate of Return” (IRR) is calculated assuming that a share is purchased today at the current price and dividends are paid for seven years growing each year at an annualized growth rate (Dividend Growth Ratio/5) and then sold in year seven after appreciating at the same annualized growth rate. The IRR is calculated in a separate tab of the workbook and imported into the 2nd Level tab.
(4) In the same separate tab a “Net Present Value” (NPV) is calculated assuming a purchase at the current share price and the same seven annual dividend payments. A 9.0% Discount Rate is used with a zero salvage value; in other words, it assumes I don’t sell the stock in year seven. The NPV is also imported into the 2nd Level tab.
(5) "Intrinsic Value" is calculated using Benjamin Graham’s formula.
(6) A “Margin of Safety” results from subtracting the “Intrinsic Value” from the current share price.
(7) The “Revenue Constrained Net Income Growth Ratio” (Growth) is the “Net Income Growth Ratio” unless the “Revenue Growth Ratio” is smaller; in which case it’s the “Revenue Growth Ratio”.
(8) A rough “Compound Annual Growth Rate” (CAGR) calculation is imbedded in a formula for the “Total Annual Return” (Return). The Return is simply the sum of the CAGR & the current Dividend Yield.
The remainder of the 2nd Level calculations will be covered in the next post.
Link to Other Topics in the Get Rich Slowly Report: What Is Intrinsic Value?
Subscribe to:
Posts (Atom)


